
to leave a comment.
▲ Bitcoin (BTC), XRP, Bart Simpson Pattern/AI Generated Image
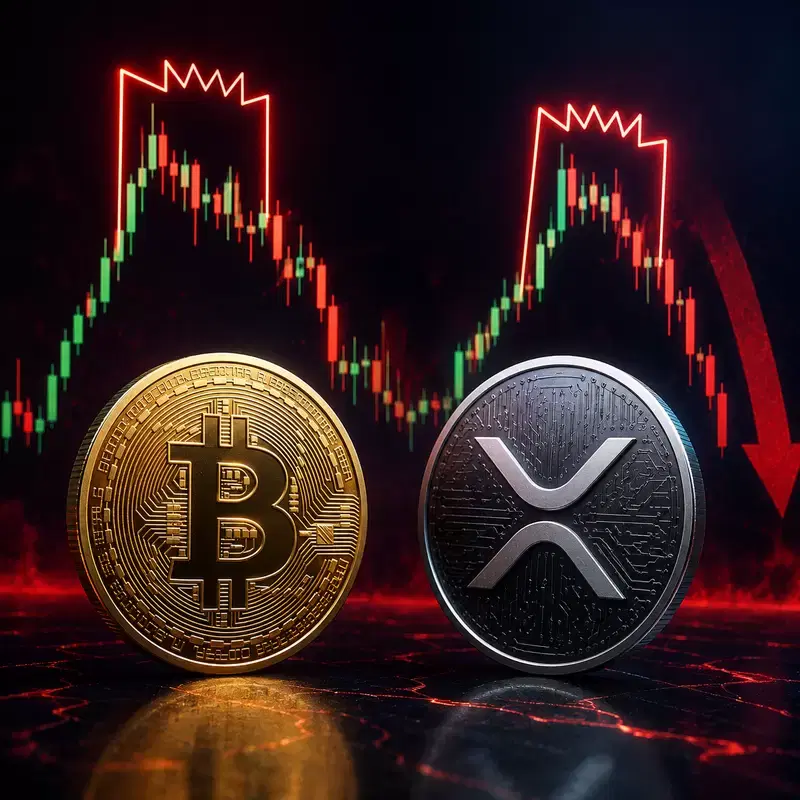
A ‘Bart Simpson pattern’ indicating a reversal of rapid gains has been observed in the charts of Bitcoin (BTC) and XRP, leading to warnings of further declines.
According to Benzinga on September 2 (local time), the Bart Simpson pattern describes a price movement where the price surges rapidly in a short period, consolidates in a narrow range, and then quickly gives back its gains. The name comes from the chart's resemblance to the head shape of the cartoon character Bart Simpson. Veteran trader Benjamin Cowen drew market attention to this pattern again by pointing it out on X (formerly Twitter) on the 1st.
Bitcoin began its ascent from $64,420 on August 19, soaring to approximately $80,700 by the 25th. Analysis suggests that the uptrend has since stalled, entering a phase of retracing its rapid gains. XRP also started at $1 on the same day, rising to $1.52 by the 22nd, but its upward momentum has since faltered. Both assets are showing similar chart patterns involving a surge, consolidation, and retracement.
Mati Greenspan, founder of Quantum Economics, explained that approximately a 20% retracement is needed for the Bart Simpson pattern to complete. However, he maintained a cautious stance on the likelihood of a sharp decline of the same magnitude for Bitcoin, given its larger market size and increased institutional participation compared to the past. He expressed stronger caution for XRP. He stated, “If XRP quickly retraces to where the rally began, it won’t just be considered a relic of 2017, but will also resemble the head shape.”
Frank Hepworth, CEO of New Market Trading, assessed the current trend as a typical distribution process where large holders leverage the buying power of retail investors to unload their holdings. For Bitcoin, the repeated failure to break above the 50-week moving average at around $81,000 was cited as a warning sign. Hepworth predicted that if selling pressure intensifies, Bitcoin could fall to $70,000 or even $58,000. He suggested that XRP might perform worse than Bitcoin during a correction, setting a downside target range of $0.46 to $1.21.
Selling pressure was also confirmed on-chain. According to CryptoQuant analyst AxelAdlerJr, Bitcoin selling by long-term holders increased by 62% from August 18 to 28, totaling 282,000 BTC. This is the highest level since the beginning of the year. With technical bearish signals coinciding with long-term holders offloading their assets, how much of the August gains can be maintained has emerged as a key variable for future trends.
[Article Key Summary]
-The Bart Simpson pattern, indicating a rapid reversal of gains, has been observed in Bitcoin and XRP charts.
-Bitcoin failed to break the 50-week moving average near $81,000, and if selling pressure increases, $70,000 or $58,000 are mentioned as potential targets.
-Analysis suggests XRP could be weaker than Bitcoin during a correction, with a downside target range of $0.46 to $1.21.
*Disclaimer: This article is for investment reference only, and we are not responsible for investment losses based on it. This content should be interpreted for informational purposes only.*
Newsletter
Get key news delivered to your email every morning
to leave a comment.