
to leave a comment.
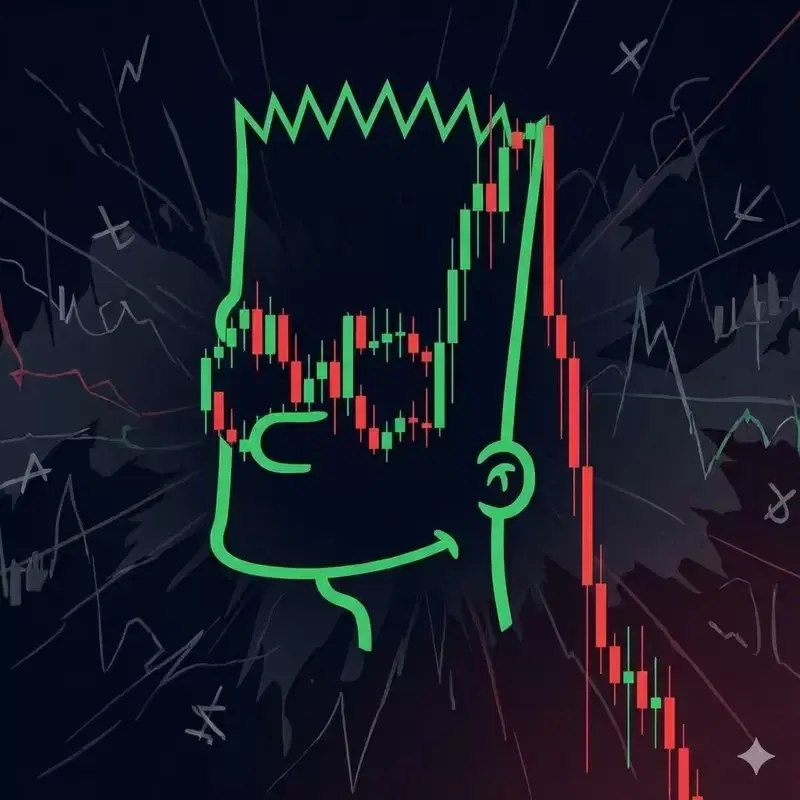
▲ Bart Simpson pattern/AI-generated image
Bitcoin (BTC) formed a 'Bart Simpson pattern' after a 25% surge in August, putting the $75,800 support level to the test.
According to BeInCrypto on September 2 (local time), several analysts diagnosed that a Bart Simpson pattern is forming on Bitcoin's 4-hour chart. This pattern involves a sharp price movement in one direction, followed by sideways trading in a narrow range, and then a rapid return to the previous price level. Bitcoin surged 25% in August, breaking past $80,000 by the end of the month.
The key price level is $75,800. An analysis suggests that a break below this level could confirm a bearish pattern. Conversely, if $75,800 holds, the bearish setup could be invalidated. If buying pressure then revives, the May high of around $83,000 could be tested again. However, the media explained that the Bart Simpson pattern itself is not a definitive signal for further decline.
A more noteworthy indicator than the chart is spot demand. Analyst CW8900 analyzed that the spot demand indicator recorded negative for two consecutive days while Bitcoin was trading sideways. In contrast, futures demand remained robust during the same period. He stated, "Without support from spot demand, there will be no bullish rally."
Selling by long-term holders also significantly increased. According to analyst Axel Adler Jr., the 30-day sum of distribution by long-term holders increased by 61.5% from 174,500 BTC on August 18 to 281,900 BTC on August 28. This is the highest level since 2026. Adler analyzed that the rebound observed after the short squeeze provided long-term holders with an opportunity to realize profits.
The future direction of Bitcoin depends on how much of the increased selling volume market demand can absorb. Upcoming US inflation and employment data are variables that will also influence the Federal Reserve's (Fed) September monetary policy decision. As weakening spot demand and increased selling by long-term holders have occurred simultaneously, the sustainability of the $75,800 support has emerged as a key turning point for the short-term market.
[Article Key Summary]
-Bitcoin formed a Bart Simpson pattern after a 25% surge in August, with $75,800 presented as a key support level.
-Spot demand recorded negative for two consecutive days, while futures demand remained robust, indicating that weakening spot buying pressure is a concern.
-The distribution volume by long-term holders increased by 61.5% from 174,500 BTC to 281,900 BTC, reaching its highest level in 2026.
*Disclaimer: This article is for investment reference only, and we are not responsible for investment losses based on it. The content should be interpreted for informational purposes only.*
Newsletter
Get key news delivered to your email every morning
to leave a comment.