
to leave a comment.
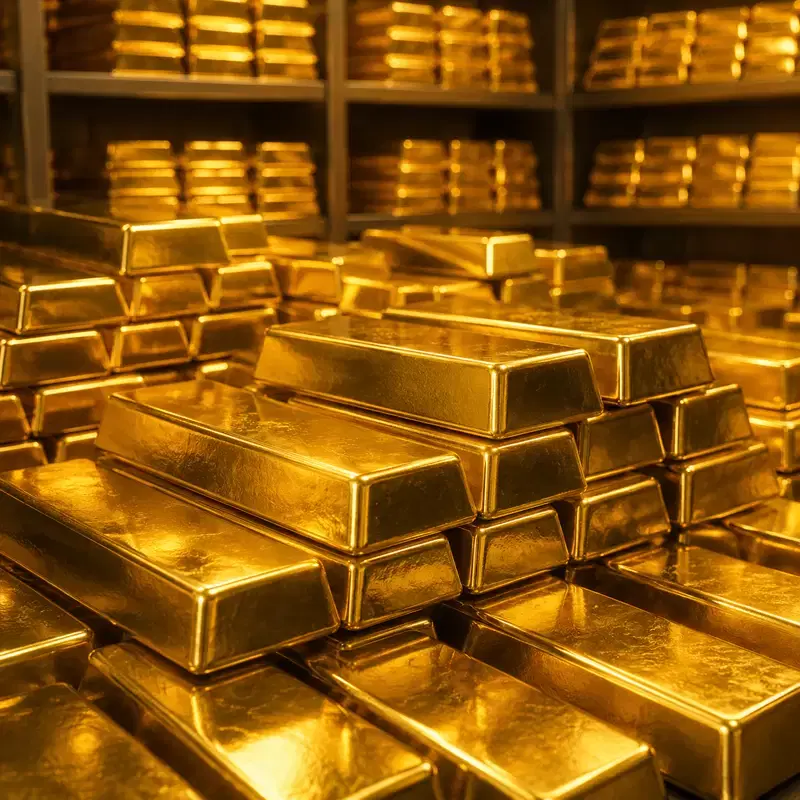
▲ Gold/AI Generated Image
Amidst a weak dollar and falling oil prices, the price of gold finally broke through resistance and surged upwards.
According to economic media outlet FXLeaders on August 5 (local time), gold (XAU/USD) broke through its major resistance level of $4,118 on Wednesday, rising to the $4,140 mark. A combination of a weak dollar, falling oil prices, and expectations that the Federal Reserve (Fed) would be less hawkish than anticipated turned the gold market bullish. Traders are now monitoring the ADP Employment Report, ISM Services PMI, and Non-Farm Payrolls (NFP) to gauge future buying and selling directions. Slowing inflation expectations, declining Treasury yields, and steady central bank demand are supporting gold prices, and traders are watching U.S. employment data for clues to the Fed's moves in September.
The rise in gold prices occurred as traders re-evaluated the possibility of further interest rate cuts in the U.S. News of progress in negotiations between the U.S., Iran, and regional mediators regarding the Strait of Hormuz led to a significant drop in crude oil prices, which in turn lowered inflation concerns. Brent crude fell to its lowest level in weeks, reducing worries about sustained high oil prices and the possibility of central banks maintaining unconventional monetary policies. The decline in oil prices lowered market inflation expectations, leading traders to view the likelihood of further Fed rate hikes as low. The probability of a rate hike in September decreased from 67% to 57%. Reduced expectations for future rate hikes typically lead to a shift of funds into gold, an asset that does not yield interest.
The U.S. dollar continues to show weakness. The U.S. Dollar Index (DXY) is under pressure as Treasury yields have fallen following the release of sluggish U.S. employment data. The Job Openings and Labor Turnover Survey (JOLTS) released on Tuesday showed 7.36 million job openings, once again indicating a slowdown in labor demand. This report has further increased the likelihood of the Fed keeping interest rates frozen in the 3.50-3.75% range. A weaker dollar has an inverse relationship with gold prices; as the dollar weakens, gold's attractiveness and demand increase.
Ahead of major economic data releases, traders will be watching the ADP private employment and ISM Services PMI before Friday's Non-Farm Payrolls report. If indicators show an economic slowdown, gold prices are likely to rise, but if employment data turns out better than expected, the dollar could strengthen, leading to a fall in gold prices.
While market data drives minor price fluctuations in the short term, other factors underpin value in the long term. According to the World Gold Council, total gold demand, including over-the-counter transactions, was 1,269 tonnes in Q2 2022, with total demand for the first half of 2022 reaching 2,522 tonnes, or $380 billion in value, reflecting historically high gold prices. Central bank demand for gold has also been very strong. Central bank physical gold purchases increased by 62% year-on-year to 289 tonnes in Q2 2022. Poland was the largest buyer, and China has also continued to increase its gold holdings. In contrast, physical purchases by individual investors in North America and Europe continue to slow. However, this is partially offset by ongoing net inflows into physical gold ETFs in several Asian markets. Robust physical gold demand, limited supply, and central bank buying are expected to support gold prices in the $4,000 range in the medium term.
From a technical analysis perspective, gold has regained bullish momentum by surpassing the $4,118 resistance level and the 100-period Exponential Moving Average (EMA). The price rose to $4,140, breaking just outside the upper boundary of the descending triangle formed in late June. With the key low of $4,022 defended multiple times and a successful rebound after a sharp downside break, buying pressure is clearly driving the price action. Both the 50-period EMA at $4,065 and the 100-period EMA at $4,118 have been decisively breached. While some profit-taking may occur near the trendline resistance as the Relative Strength Index (RSI) registers 67, indicating strong bullish momentum, the overall upward trend is not expected to be significantly affected.
A break above $4,148 and the descending trendline could open the way to $4,187, and further to $4,220. The primary support level is $4,118, with the next important level at $4,065. A breakdown of this zone could be interpreted as bearish, with potential retracements to $4,022 and $3,996.
[Article Summary]
-Gold prices broke through the $4,118 resistance level and rose to $4,140, driven by a weak dollar, falling oil prices, and expectations of a less hawkish Fed stance.
-The probability of a September rate hike decreased from 67% to 57%, and job openings were 7.36 million, indicating a slowdown in labor demand.
-Technically, if gold surpasses $4,148, it could rise to $4,187 and $4,220, with support levels at $4,118 and $4,065.
*Disclaimer: This article is for investment reference only, and we are not responsible for any investment losses based on it. The content should be interpreted for informational purposes only.*
Newsletter
Get key news delivered to your email every morning
to leave a comment.