
to leave a comment.
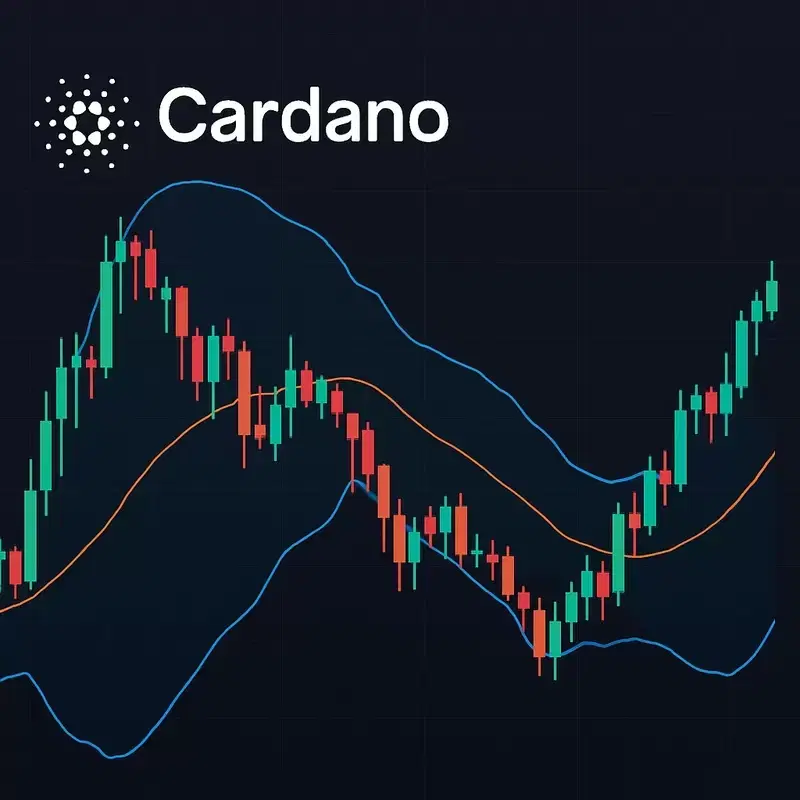
▲ Cardano (ADA)
Key indicators that could signal a technical rebound in the global cryptocurrency market have been observed, drawing significant attention from investors.
According to U.Today, a cryptocurrency specialized media outlet, on July 8 (local time), a bullish divergence in the Relative Strength Index (RSI) indicating weakening selling pressure has occurred on Cardano's (ADA) daily chart. While this is not yet a definitive confirmation of the complete end of the downtrend, it is a strong technical signal showing that the momentum of selling pressure is noticeably slowing down even as the price hits new lows. Technical analysts suggest that this rebound energy has been condensed between two lows formed approximately three weeks apart. Indeed, after falling to $0.1487 on June 8, where the RSI recorded an extremely oversold level of 12.78, the price dropped further to $0.1380 on June 25, but the index actually formed a higher low at 25.10.
Currently, the index has risen to 47.57, and the signal line is at 42.93, demonstrating structural improvement in the indicator. If the index breaks through and settles above the 50-line in the future, it will provide crucial evidence supporting a complete shift in market dominance to buyers. Alongside this, key support and resistance lines set based on Fibonacci retracement levels are also considered critical turning points that will determine future direction. The most important short-term support level is currently formed at the Fibonacci 78.6% retracement line of $0.16169, and maintaining this level based on the daily closing price is essential to preserve the validity of the bullish divergence. If this support line breaks, there is a risk of retreating through the Fibonacci 88.8% retracement line of $0.14993 to the low of $0.13800 on June 25.
Conversely, if buying pressure leads to a successful rebound, the first target price to reclaim for short-term structural improvement is the Fibonacci 61.8% retracement line of $0.18311. This zone is closely aligned with the upper Bollinger Band, currently at $0.19128, suggesting it is likely to act as a strong resistance area. If the upward resistance line is decisively broken with accompanying trading volume, approximately 35% of additional upside potential will open up from the current price, paving the way to advance to the Fibonacci 33% retracement line of $0.22663. In a long-term perspective, the final major resistance level is identified around the previous high of $0.28935.
The MACD (Moving Average Convergence Divergence) auxiliary indicator also supports the clear slowdown in selling pressure. The MACD line currently stands at 0.00462, and the signal line is positioned at minus 0.00095. The histogram, which remained deep in negative territory during the market crash in June, is gradually moving closer to the zero (0) line, attempting a transition into positive territory. Although the price for the day is undergoing a temporary adjustment and maintaining a neutral position around $0.16697, the medium-term downward pressure is considered to have been largely offset.
[Article Summary]
-A bullish divergence has been observed on Cardano's daily chart, where the price low decreased but the RSI low increased, signaling a slowdown in selling pressure.
-To maintain technical validity, holding the Fibonacci 78.6% retracement line at $0.16169 is essential; a breakdown could lead to a fall to $0.13800.
-If a rebound occurs, breaking the $0.18311 resistance line is a turning point for a short-term trend reversal, and success could open up an additional ~35% upside opportunity, potentially reaching $0.22663.
*Disclaimer: This article is for investment reference only, and we are not responsible for any investment losses based on it. The content should be interpreted for informational purposes only.*
Newsletter
Get key news delivered to your email every morning
to leave a comment.