

to leave a comment.
On July 30, 2026, global financial markets showed an unstable trend due to concerns about the hawkish stance of the U.S. Federal Reserve's (Fed) decision to freeze interest rates, despite the decision, and geopolitical tensions in the Middle East. The U.S. 10-year Treasury yield remained high at 4.61%, and risk aversion sentiment spread as the S&P 500 closed down 1.54% at $729.46 and the NASDAQ 100 fell 2.04% to $661.73. The VIX fear index remained high at 22.53, reflecting market anxiety.
The cryptocurrency market was also not immune to these macroeconomic pressures. The total market capitalization recorded $2271.2B, with Bitcoin (BTC) showing a slight increase of 0.40% over 24 hours but trading at $63983.0, down 3.20% over 7 days. Ethereum (ETH) also fell 1.50% over 7 days, staying at $1910.77. In particular, Bitcoin spot ETFs experienced net outflows for four consecutive trading days, signaling a weakening of investment sentiment. Conversely, Ethereum spot ETFs recorded net inflows for two consecutive trading days, showing a somewhat differentiated trend from Bitcoin. Overall investment sentiment remained in the fear zone, with the Fear & Greed Index at 28 (Fear).
However, amidst this overall market downward pressure, individual bullish movements were detected in some altcoin futures markets. We will conduct an in-depth analysis of the nature of these individual trends and inherent risk factors through the top-performing assets in the Binance USDT-M futures market.
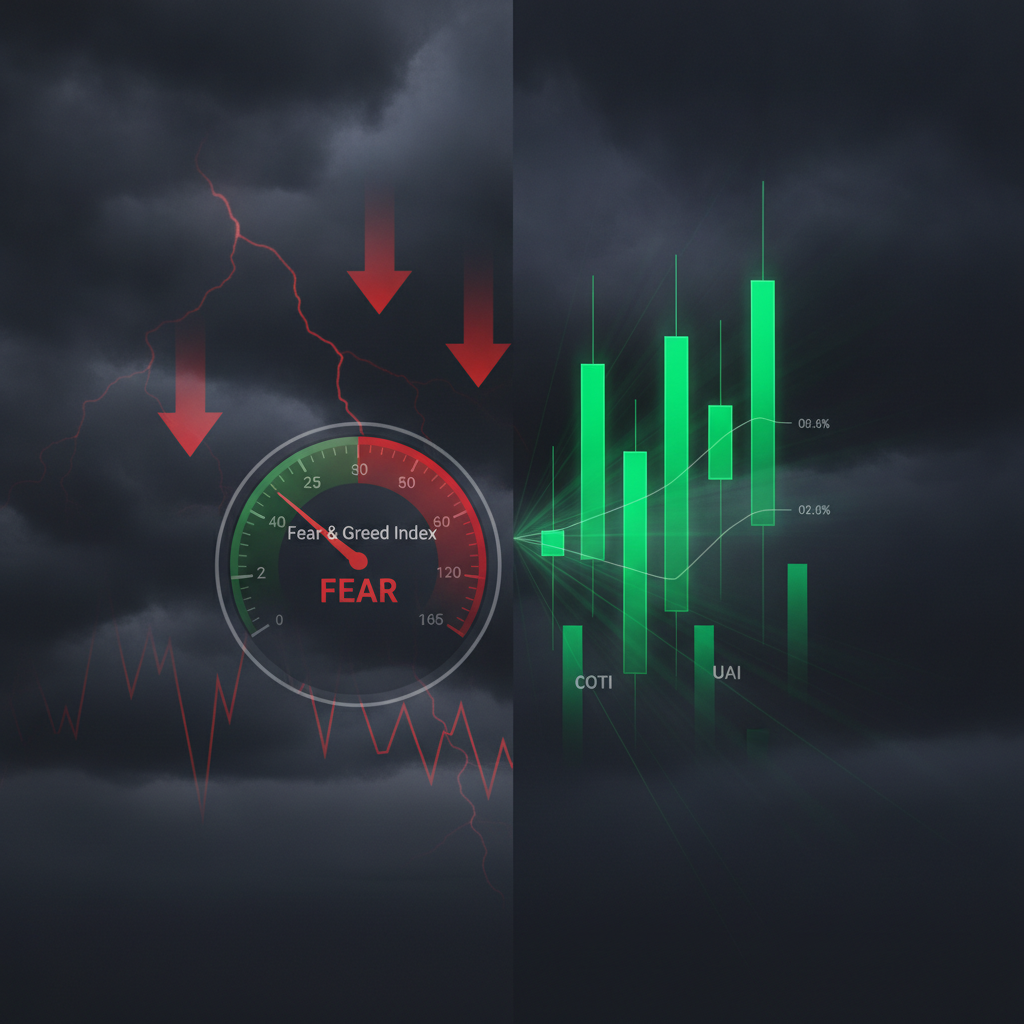
COTIUSDT led the Binance USDT-M futures market with a record 24-hour surge of 73.36%. The current price is $0.019146, with a 24-hour trading volume of $616.7M and Open Interest (OI) of $881.1M, forming a significant scale. Notably, the funding rate recorded -0.000370 (-0.04%).
Despite the sharp price increase, rising Open Interest, and explosive trading volume, a negative funding rate suggests several possible scenarios. First, strong long position inflows may have occurred alongside forced liquidation of existing short positions (short squeeze). However, it is also possible that after short positions were liquidated, new short positions entered, or long positions entered with lower leverage, resulting in complex supply and demand dynamics. Second, the possibility that market participants are actively building short positions due to concerns about a short-term peak, despite the price increase, cannot be ruled out.
Looking at the daily data over the past 7 days, COTIUSDT showed a sustained bullish trend, starting with a 43.88% surge to $0.010676 on July 27, followed by an additional 57.13% increase to $0.01709 on July 29. On July 30, it rose another 11.81% to $0.019113, but the daily trading volume was $20.0M, significantly lower than previous surge days. This suggests that the intensity of buying pressure may have temporarily slowed, or selling pressure emerged at key price levels.
In conclusion, COTIUSDT has shown a strong upward trend, but considering the negative funding rate and today's reduced trading volume, it may have entered a period of increased short-term volatility. The probability of trend continuation is estimated at 55% versus 45% for a pullback. The risk of new entry at this point is rated as high. Key variables to watch are whether the negative funding rate turns positive, or if the price declines without additional trading volume inflows.
UAIUSDT rose 49.69% over 24 hours to $0.4573. Open Interest (OI) is relatively small at $26.0M, but the 24-hour trading volume was $128.7M, indicating active trading relative to OI. The funding rate was 0.000260 (+0.03%), showing a slightly positive value.
UAIUSDT's surge was primarily driven by a 42.76% jump to $0.437 on July 29, accompanied by a large trading volume ($125.2M). This rebound, occurring after a long period of sideways movement or decline, likely saw the liquidation of existing short positions as the main driving force. However, on July 30, it only rose 4.62% to $0.4572, and trading volume significantly decreased to $3.5M compared to the previous day. This suggests that buying pressure weakened after the surge, leading to increased cautiousness, or some profit-taking occurred.
A slightly positive funding rate indicates that long positions are dominant but not yet in an overheated stage. However, reduced trading volume suggests short-term volatility expansion rather than trend continuation. The probability of trend continuation is estimated at 30% versus 70% for a pullback. The risk of new entry at this point is rated as medium. Key variables to watch are whether the price holds after the surge without significant trading volume.
PRLUSDT rose 17.84% over 24 hours to $0.2147. Open Interest (OI) is $18.8M, and 24-hour trading volume is $14.8M, indicating lower liquidity compared to other top-performing assets. The funding rate was 0.000229 (+0.02%), showing a negligible positive value.
PRLUSDT's price movement saw a temporary increase in trading volume on July 29 with a 16.65% rise to $0.2123, followed by a sharp drop in trading volume to $327K on July 30 with a 1.08% rise to $0.2147. This suggests that in a low liquidity environment, even small amounts of capital could cause a sharp price increase. The small Open Interest and non-overheated funding rate increase the probability that this was a short-term price movement driven by a specific entity. The absence of subsequent buying pressure could threaten price stability.
This situation is more likely to be interpreted as a short-term surge due to volatility rather than a trend-driven ascent. The probability of trend continuation is estimated at 20% versus 80% for a pullback. The risk of new entry at this point is rated as high. Key variables to watch are whether the current price level can be maintained without the inflow of buying liquidity.
SOXSUSDT rose 16.69% over 24 hours to $70.47. Open Interest (OI) is a very minimal $111K, but the 24-hour trading volume was an overwhelming $609.2M. The funding rate was 0.000000 (+0.00%), indicating a neutral state.
This asset is a tokenized version of the Direxion Daily Semiconductor Bear 3X Shares ETF, which bets on a decline in the semiconductor sector. Considering that the S&P 500 and NASDAQ 100 recently fell by 1.54% and 2.04% respectively in the U.S. stock market, and negative news related to AI semiconductors flooded, SOXSUSDT's rise is interpreted as reflecting these market conditions. It showed a continuous strong upward trend from July 27 to 29, with a particularly large trading volume accompanying a 16.84% rise to $72.35 on July 29. On July 30, it took a breather, falling 2.64% to $70.44.
Extremely low Open Interest coupled with very high trading volume suggests that active trading in spot or other derivative markets may have influenced the price. A neutral funding rate could mean less excessive position bias in the futures market. If the macroeconomic weakness in the semiconductor sector continues, there may be further upside potential. The probability of trend continuation is estimated at 60% versus 40% for a pullback. The risk of new entry at this point is rated as medium. Key variables to watch are further decline in the global semiconductor sector and the overall direction of the U.S. stock market.
ACHUSDT rose 16.01% over 24 hours, reaching $0.005073. Open Interest (OI) is a significant $528.4M, and 24-hour trading volume recorded $40.7M. Notably, the funding rate was significantly negative at -0.001647 (-0.16%).
A negative funding rate means that short positions are dominant over long positions, or that short position holders are paying a premium to maintain their positions. When the price rises in such a situation, it suggests that a strong short covering (short squeeze) occurred, or that short positions absorbed liquidity against expectations, pushing the price up. On July 29, it rose 13.21% to $0.004969 with increased trading volume, and on July 30, it rose 2.09% to $0.005073, but trading volume sharply decreased to $578K.
If a strong negative funding rate is maintained despite high Open Interest, it can be interpreted as meaning that short positions are still numerous, or that new short positions are actively entering. If short covering was the main upward driver, and subsequent buying pressure does not follow, the price is likely to fall again. The probability of trend continuation is estimated at 40% versus 60% for a pullback. The risk of new entry at this point is rated as high. Key variables to watch are whether short positions strengthen again when price appreciation slows without the negative funding rate being resolved.
VELVETUSDT rose 13.19% over 24 hours, with a funding rate of 0.000139 (+0.01%), a slightly positive value. After a 12.81% surge on July 29, it rose 1.41% on July 30 with significantly reduced trading volume, possibly indicating a short squeeze followed by sideways trading similar to UAIUSDT. HOLOUSDT rose 11.66%, with a very low funding rate of 0.000050 (+0.01%). LABUSDT rose 10.52%, with a relatively high funding rate of 0.000562 (+0.06%), suggesting a need to be cautious of short-term overheating of long positions. REUSDT rose 9.99%, but its funding rate was low at 0.000050 (+0.01%).
Amidst amplified macroeconomic uncertainty due to the Fed's hawkish rate freeze and stock market declines, the cryptocurrency market as a whole is dominated by fear sentiment due to Bitcoin spot ETF outflows. However, some altcoin futures markets saw short-term surges in individual assets like COTI, UAI, and ACH, which appear to be primarily due to short squeezes, surges in low liquidity environments, or hedging demand in a semiconductor downturn.