
to leave a comment.
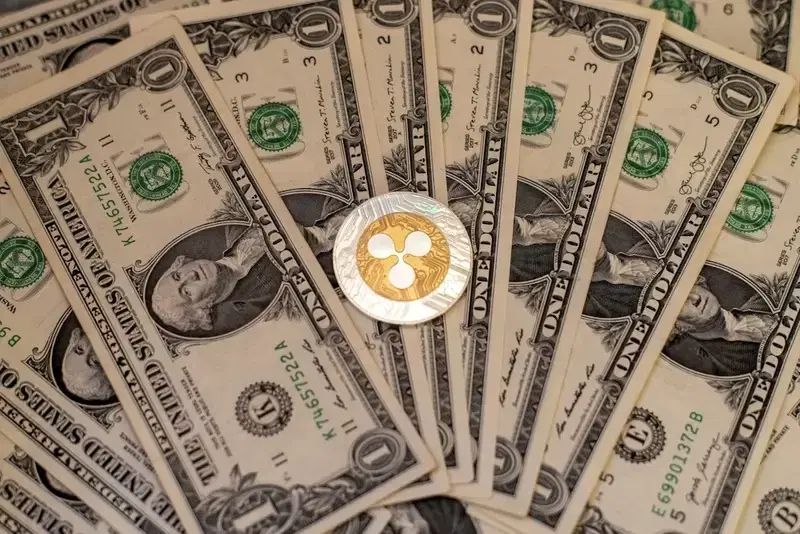
▲ XRP, Dollar (USD)
Although XRP has fallen approximately 64% from its multi-year high recorded in July 2025, on-chain indicators and chart structures again point to past trends where strong price rebounds followed periods of extreme fear.
According to cryptocurrency media outlet Cointelegraph on May 27 (local time), XRP's 30-day Market Value to Realized Value (MVRV) dropped to -47%. This is the lowest level since December 2020. On-chain data provider Santiment stated via X (formerly Twitter) that "historically, MVRV has eventually converged to an average of 0%, and the current level represents an extreme undervaluation zone for XRP."
Santiment analyzed that individual investors' fear and frustration often reached extremes when MVRV remained deeply in negative territory. However, it cautioned that a weak MVRV alone does not guarantee a complete trend reversal. Santiment explained, "It often indicates a period where most panic selling has already occurred, and downside risk is limited compared to potential upside." According to Glassnode data, XRP's MVRV Z-score also hovers around 0, aligning with past accumulation phases and market bottoms.
XRP Ledger activity has also been presented as an indicator increasing the likelihood of a rebound. CryptoQuant analyst TopNotchYJ diagnosed that XRP Ledger transaction volume surged in April, stating, "Deep ecosystem activity and accumulation are quietly forming beneath the surface." He noted that "a massive vertical surge in transaction counts is an early network leading indicator that precedes explosive price expansion." Cointelegraph reported that after a surge in transaction counts in November 2019, XRP rose approximately 1,200% from $0.15 to $1.79 in 2021, and a 600% increase was also observed from $0.50 in July 2024 to $3.17 by mid-2025.
Currently, XRP is moving within a key accumulation zone between $1.30 and $1.50. TopNotchYJ analyzed that the surge in large-scale network activity suggests the formation of a stable macro bottom for XRP's price. He stated, "If history repeats and the current sideways movement solidifies as a launchpad, a conservative 5x macro outlook places XRP's next major target range between $7.50 and $8.00."
From a technical perspective, XRP is trading within a falling wedge pattern on the weekly chart. Cointelegraph analyzed that since July 2025, the price has been compressing between two descending trendlines, with the lower boundary near the psychological support level of $1.30. The weekly Relative Strength Index (RSI) recovered from oversold territory, signaling a slowdown in selling pressure. If XRP decisively breaks above the upper trendline of the falling wedge at $1.50, a chart target of $3.10, approximately 134% higher than the current price, is suggested. However, to confirm a long-term trend reversal, XRP must break and sustain above the $1.40 to $1.60 resistance zone on the daily chart.
*Disclaimer: This article is for investment reference only, and we are not responsible for any investment losses based on it. The content should be interpreted for informational purposes only.*
Newsletter
Get key news delivered to your email every morning
to leave a comment.